The Harvest computer program was custom built by Food Standards Australia New Zealand (FSANZ) to calculate dietary exposure to food chemicals such as food additives, pesticides, contaminants, nutrients and other food ingredients.
How is Harvest set up?
There are currently two main parts to the Harvest system: the data storage component and the dietary exposure assessment component.
What data are stored in Harvest?
Harvest requires two main sets of data to estimate dietary exposure:
- the concentration of the food chemicals in specific foods
- data on the food consumption levels of those foods and information about the consumers such as their age, gender and body weight.
Other data sets used include:
- food classification or grouping systems, so similar foods can be grouped together for calculation or reporting purposes
- recipe datasets to break down mixed foods to their basic ingredients
- food conversion factors, to convert the consumption of some foods between raw and cooked, or raw and processed versions, and
- health-based guidance values which indicate a safe level of exposure or required level of intake.
Where do food chemical concentration data come from?
Food chemical concentration data come from a range of sources including:
- survey data for a wide range of chemicals, including data from total diet surveys and other government surveillance surveys
- trial data (for agricultural and veterinary chemicals)
- food composition tables (for nutrients)
- manufacturers' data for the level of use (for food additives and novel foods or ingredients)
- maximum permission levels from food standards (Australia New Zealand Food Standards Code or other relevant international standards) such as:
- maximum permitted level (MPL) for food additives
- maximum residue limits (MRL) for pesticide and veterinary drug residues
- maximum levels (MLs) for contaminants
- permitted levels of nutrient fortification.
What food consumption data are used?
Food consumption data used in Harvest are from national nutrition surveys from both Australia and New Zealand. Those most recent ones being used are:
- 2011-12 Australian National Nutrition and Physical Activity Survey (NNPAS) for 2 years and above
- 2002 New Zealand Children's Nutrition Survey (NZCNS) for children 5 -14 years
- 2008 New Zealand Adult Nutrition Survey (NZ ANS) for 15 years and above.
Data from other surveys such as targeted surveys for specific sub-population groups can also be included in Harvest.
What types of dietary exposure assessments can Harvest run?
Harvest includes options for running assessments or 'models' using different food consumption data and food chemical data. These are:
- a 'food additive' exposure model that is suited to estimating dietary exposure to chemicals such as food additives and food ingredients that are added to processed foods
- a 'raw commodity' model that is suited to estimating dietary exposure to food chemicals such as pesticide residues and contaminants that originate in basic food commodities
- a 'nutrient intake' model that can estimate nutrient intakes.
All model types have the capability to produce food consumption data. The food additive and raw commodity models also use the Harvest recipe datasets to include dietary exposure of the food chemical from mixed foods and dishes.
Harvest is flexible and can be set up according to the food chemical being assessed, the data set available and the purpose of the assessment. Models can be set up to include a mixture of both processed foods and raw commodities.
How does Harvest use the data to estimate dietary exposure?
Harvest uses every person's food consumption data from the national nutrition survey selected and works out what foods they ate that may contain the food chemical being assessed. This includes calculating how much of each food they consumed from mixed foods by using specially developed recipes. For example, how much milk they drank as a glass of milk as well as how much milk they consumed in tea or coffee, or from sauces, puddings, cakes and other foods that contain milk.
Then Harvest multiplies the amount of food consumed by the concentration of the chemical in that food. It repeats this for each food that contains the chemical. For each person it adds up the estimated dietary exposure from all foods.
Harvest then divides the dietary exposure by that person's individual body weight (if required). It then ranks estimated dietary exposures for all people in the group being assessed and generates population statistics such as mean, median and 90th percentiles.
We may report our results for 'all respondents', which means for everyone who took part in the national nutrition survey, or for 'consumers only'. 'consumers' are the subset of people who were exposed to the chemical in question or ate the food in question, depending on the assessment. We may report results for both respondents and consumers.
We may also subdivide respondents and consumers by age group or by gender, if this is relevant.
Average (mean) exposure or intake is usually reported as well as exposure or intake for the high consumer, representing those who have a high exposure to, or intake of, a particular food or food chemical where relevant for the assessment.
The dietary exposures are then compared to the relevant health-based guidance value (if applicable).
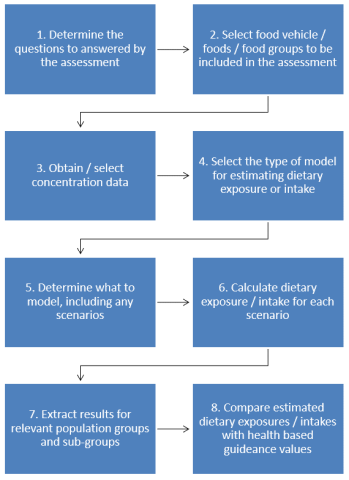
How Harvest is used in dietary exposure assessments
The following diagram summarises the process of conducting a dietary exposure or intake assessment using Harvest: