FSANZ collects and reports annual and decadal data on Australian food recalls. The data presents the reasons for food recalls and the types of foods recalled, as well as detailed analysis of causes (e.g. allergens and contaminants) and corrective actions taken by food businesses. Our statistics help identify trends and common issues in food recalls, supporting effective management and prevention of future incidents.
Foods recalled annually represent a very small proportion of total products available in the Australian food supply. Most recalls are taken as a precautionary measure by the food businesses to ensure potentially unsafe food is removed from distribution and sale. Only a small number of food recalls are linked to reported cases of illness or injury.
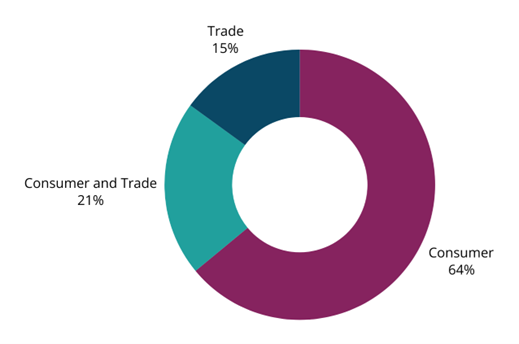
There are two types of food recalls - consumer and trade. A trade recall is conducted when the food has not been available for direct purchase by the public (e.g. food sold to wholesalers and caterers). A consumer recall occurs when the food has been available for retail sale. While food recalls generally can be categorised as consumer or trade, some recalled products may fall into both categories. Figure 1 shows that from 2020 to 2024, the majority of recalls coordinated by FSANZ were consumer recalls only (64%). Trade recalls and trade and consumer recalls accounted for 15% and 21% respectively.
Figure 1. Food recalls by recall type (2020-2024)
Food recalls over the past 10 years
FSANZ coordinated a total of 855 recalls from 1 January 2015 to 31 December 2024, including 95 recalls in 2024. While the number of recalls fluctuates year-to-year, the average annual number of recalls has shown an upward trend over the past decade (see Figure 2). The average number of recalls per year from 2015-2024 was 86, compared to 84 recalls per year for the period 2014-2023.
Figure 2. Food recalls by year (2015-2024)
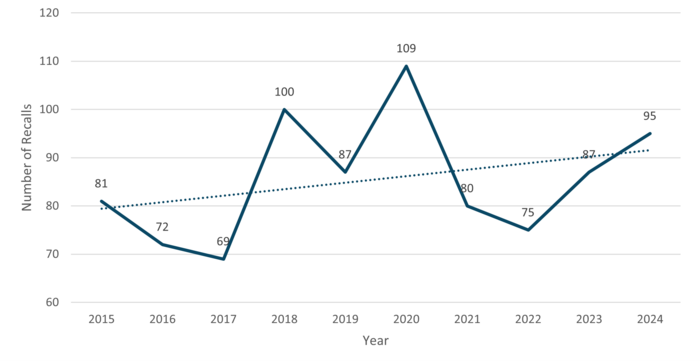
A year-on-year or average annual increase in the number of food recalls can point to particular issues in the food supply but also indicate system safeguards are working. Over time, wider regulatory oversight, improved self-monitoring by food businesses and greater consumer vigilance have helped to strengthen problem detection. Continued advancements in food technology, analytical testing and traceability are also expected to influence the number of food recalls.
Understanding food recalls: a look at the past 5 years
Reasons for food recalls
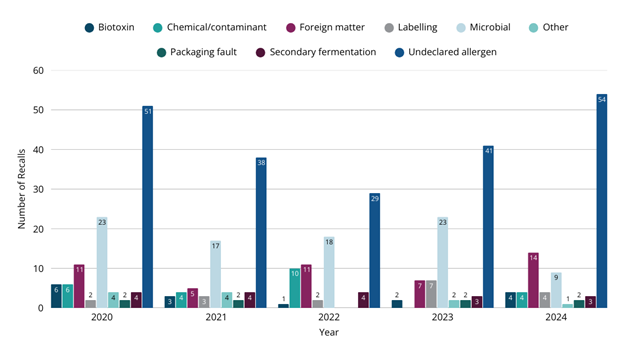
Food recalls occur for a variety of reasons which are categorised into Contamination (microbial, chemical, biotoxin), Undeclared allergens, Incorrect labelling, Packaging faults, Secondary fermentation or Foreign matter. As shown in Figure 3, the most common reasons for recalls from 2020 to 2024 were Undeclared allergens (48%) and Microbial contamination (20%). In contrast, Biotoxins and Packaging faults accounted for a small proportion of recalls annually. The Other category encompasses various recall reasons not already listed, such as products containing prohibited ingredients.
Figure 3. Food recalls by year and reason for recall (2020-2024)
Types of food recalled
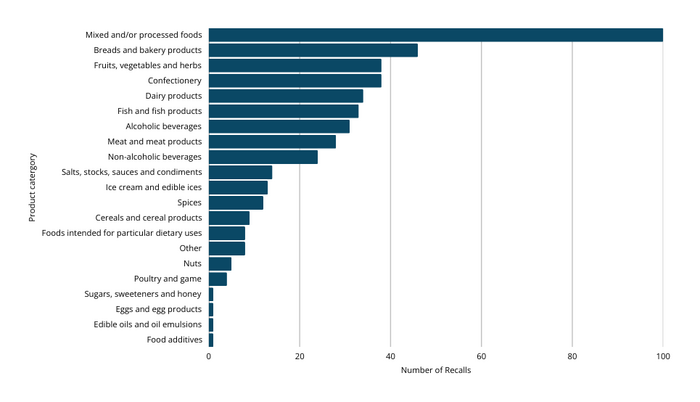
A wide variety of food products ranging from fresh produce to processed foods are recalled every year. From 2020 to 2024, the most commonly recalled food products were Mixed and/or processed foods and Bread and bakery products (see Figure 4). Fruit and vegetables, Confectionery and Dairy products were also amongst the most commonly recalled food products.
Figure 4. Food recalls by product category (2020-2024)
Corrective actions
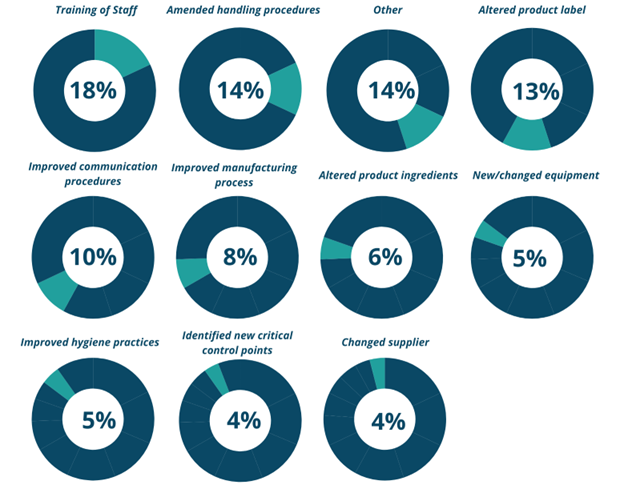
Food businesses who have undertaken a recall are required to report the corrective actions they have taken to address identified issues. From 2020 to 2024, the most commonly reported corrective actions were Staff training (18%), Amended handling procedures (14%) and Altering product labels (13%) (see Figure 5). The Other category included corrective actions such as Increased testing and Ceasing production or supply. It is worth noting that the majority of food business (83%) reported undertaking more than one corrective action.
Figure 5. Food business corrective actions (2020-2024)
Undeclared allergen food recalls
Food products not compliant with the allergen labelling requirement set out in the Australia New Zealand Food Standards Code can pose a serious risk to people with allergies. Food products are often recalled due to the presence or the potential presence of an undeclared allergen(s).
Undeclared allergens continue to be the primary reason for food recalls in Australia. From 2020 to 2024, there were 213 food recalls due to Undeclared allergens. Table 1 shows the number and percentage of total recalls due to Undeclared allergens over the past 5 years.
Table 1. Undeclared allergen food recalls (2020-2024)
| Year | Number of recalls due to Undeclared allergen(s) | % of total recalls for that year |
|---|---|---|
| 2020 | 51 | 47% |
| 2021 | 38 | 48% |
| 2022 | 29 | 39% |
| 2023 | 41 | 47% |
| 2024 | 54 | 57% |
| Total | 213 |
Allergen types
Most Undeclared allergen recalls were due to the presence of a single undeclared allergen. However, 20% of were due to the presence of multiple undeclared allergens. Figure 6 illustrates the allergen types associated with recalls over the past 5 years. The most common Undeclared allergen types were Milk, Tree nuts, Wheat/Gluten and Eggs.
Figure 6. Allergen types associated with food recalls (2020-2024)

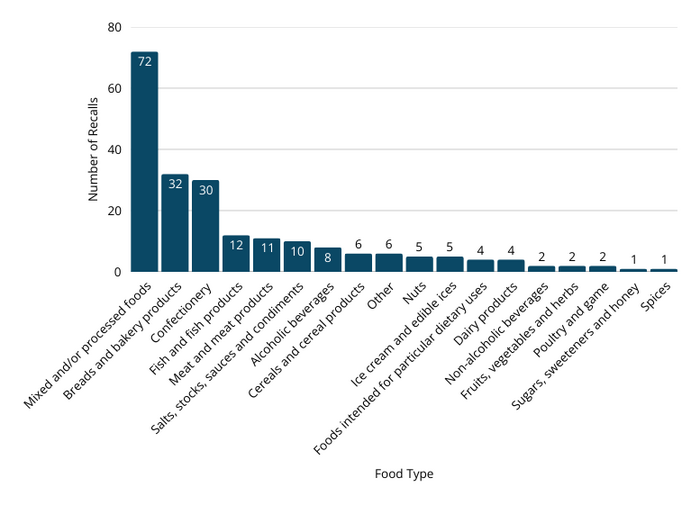
From 2020 to 2024, the most common food type associated with Undeclared allergen recalls was Mixed and/or processed foods (72 recalls; 34%) followed by . Breads and bakery products (32 recalls; 15%), and Confectionery (30 recalls; 14%) (see Figure 7)
Figure 7. Distribution of undeclared allergen recalls by food type (2020-2024)
Undeclared allergens - problem detection
FSANZ collects data on the method of detection to pinpoint how food products containing undeclared allergens are identified. Table 2 illustrates the five detection categories, with Customer complaints being the most common method. Other includes methods not captured by other categories or where this information was not reported.
Table 2. Problem detection for undeclared allergen recalls (2020-2024)
| Detection method | |||||
|---|---|---|---|---|---|
| Year | Customer complaint | Distributor or retailer complaint | Routine government testing | Routine testing by the company | Other |
| 2020 | 18 | 2 | 12 | 8 | 11 |
| 2021 | 20 | 0 | 8 | 0 | 10 |
| 2022 | 11 | 1 | 3 | 9 | 5 |
| 2023 | 19 | 1 | 8 | 6 | 7 |
| 2024 | 20 | 5 | 4 | 10 | 15 |
| Total | 88 | 9 | 35 | 33 | 48 |
Undeclared allergens - root cause
FSANZ uses information provided at the time of recall and in the post recall report to determine the root cause of Undeclared allergen recalls. FSANZ has reviewed allergen-related recalls and categorised these into the following five root causes:
- Accidental cross contamination - contamination of either raw ingredients or during the final production process.
- Allergen labelling knowledge - a lack of allergen labelling awareness or the misinterpretation of standards by a food business.
- Error during packaging - errors that occur during packaging e.g. a product being packaged in the wrong packaging or incorrectly labelled.
- Label error - examples include labelling errors resulting from the incorrect translation or reformulation of ingredients.
- Supplier verification issues - ingredient changes by a supplier were not communicated.
- Unknown - unable to determine what caused the issue at the time of recall.
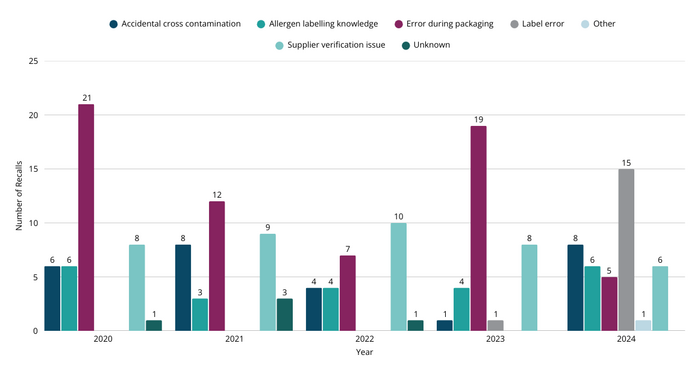
Of the reports received by FSANZ, Errors during packaging were the predominant cause of allergen-related recalls from 2020 to 2024 (see Figure 8). Labelling errors constitute a relatively large portion of allergen-related recalls in 2024, likely due to the implementation of Plain English Allergen Labelling requirements. It is worth noting that the majority of Undeclared allergen recalls can successfully trace back and identify the root cause of the issue.
Figure 8. Number of Undeclared allergen recalls by root cause (2020-2024)
Microbial contamination food recalls
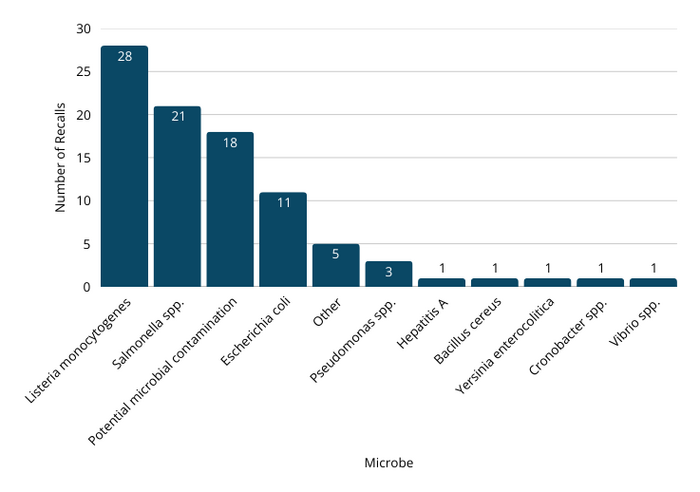
Microbial contamination refers to the presence in food of a harmful bacteria, viruses, fungi or parasites that can cause foodborne illness. Food products are often recalled due to microbial contamination. From 2020 to 2024 there were 90 food recalls due to microbial contamination, one of which was attributed to multiple microbe types. As shown in Figure 9, the most common microbes were Listeria monocytogenes (28 recalls; 31%), Salmonella spp. (21 recalls; 23%) and Escherichia coli (E. coli) (11 recalls; 12%). There were also 18 recalls due to the Potential microbial contamination.
Figure 9. Food recalls due to microbial contamination (2020-2024)
Foreign matter food recalls
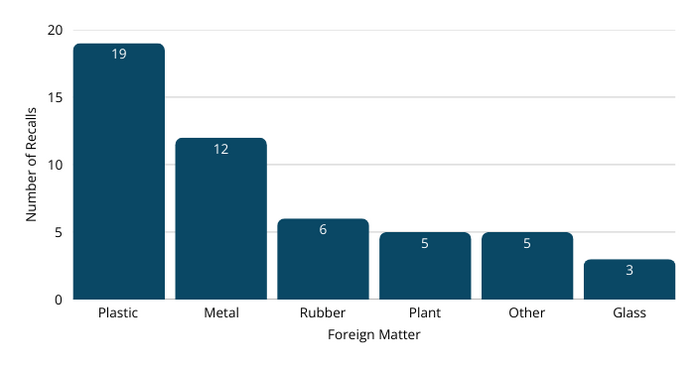
The presence of foreign matter like glass, metal or plastic in food can cause injuries. From 2020 to 2024 there were 48 recalls due to foreign matter, 2 of which were attributed to multiple types of foreign matter. The most common types of foreign matter were plastic (19 recalls; 40%), metal (12 recalls; 25%) and rubber (6 recalls; 13%) (see Figure 10). The Other category includes foreign matter like biological matter and intrinsic objects.
Figure 10. Food recalls due to foreign matter (2020-2024)
Biotoxin food recalls
Biotoxins are toxic substances produced by a range of living organisms including fungi, animals and plants. Food products contaminated with biotoxins pose a health risk and may cause illness or injury if consumed. From 2020 to 2024 there were 16 recalls due to Biotoxins. As shown in Figure 11, the most common biotoxins were Patulin (6 recalls; 38%), Histamine (3 recalls; 19%) and Marine toxins (2 recalls; 13%).
Figure 11. Food recalls due to biotoxins (2020-2024)

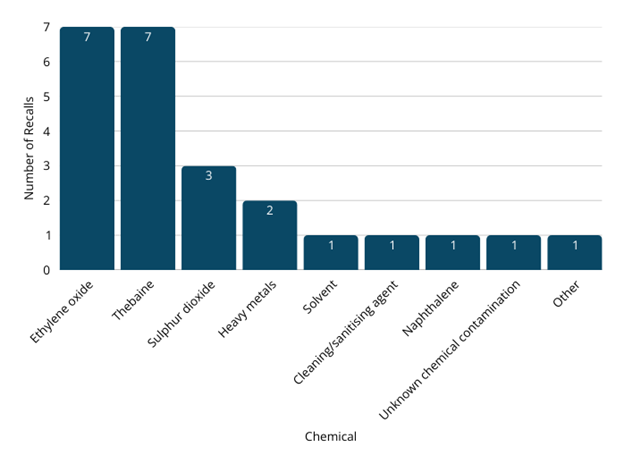
Chemical/contaminant food recalls
Contamination with chemicals like cleaning products and pesticides or high levels of additives can make food unsafe for consumption. From 2020 to 2024 there were 24 food recalls due to Chemical and other contaminants. The most common contaminants were Ethylene oxide (7 recalls; 29%), Thebaine (7 recalls; 29%) and Sulphur dioxide (3 recalls; 13%) (see Figure 12 below).
Figure 12. Food recalls due to chemical/contaminant (2020-2024)